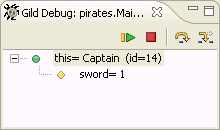

The Gild Debug View is used when you need to understand unexpected results that are occurring in your Java programs. The debugger is for logical or runtime errors, and will not help you if you have a compiler error. When you first debug in Gild, the debug view will be located to the far-right of your screen. When you are not debugging, this view will be blank. The Debug View will be discussed further in the section "Accomplishing Common Tasks>Logic Errors and the Gild Debugger". The Debug View contains resume, terminate, step-over, and step-into features.
Resume Resume may be used when your program is stopped on a breakpoint or after a step operation (described below). It will start running your program from the current position, and continue running it until another breakpoint is reached, or until the program terminates. Terminate Immediately stops your program from running, without executing any more code. Step Over Executes one line of code (marked with a in the Gild Editor).If the line contains a method call, that method will run to completion. You will not be brought into the method, you will "Step Over" the method. .
Step Into Executes one line of code (marked with a in the Gild Editor). If the current line is a method call, and the source code for the method can be found, you will "Step Into" the method. The next code executed in your program will be the first executable line of the method that you have just "stepped into." If the source code of the method cannot be found, this facility will act as
"Step Over" does.
The tasks involved in debugging will be further discussed in the section "Accomplishing Common Tasks>Logic Errors and the Gild Debugger".